Multiple instances of the same model on a single page

More or less from the outset, it has been possible to have widgets for multiple models on the same Systo page.    For example, to have the model diagram, sliders and plots for the Miniworld model and for a predator-prey model on the same page.

For some time, I have been thinking that it would be great if you could have more than one instance of the same model on a page.  You could then work with each one independently – changing the model diagram of one copy without affecting the other, changing the parameter values (via sliders) for one independently of the other, or making more radical changes to one of the copies.    This could be really useful for comparing alternative model-diagram layouts, alternative parameter settings, or alternative model structures and equations.

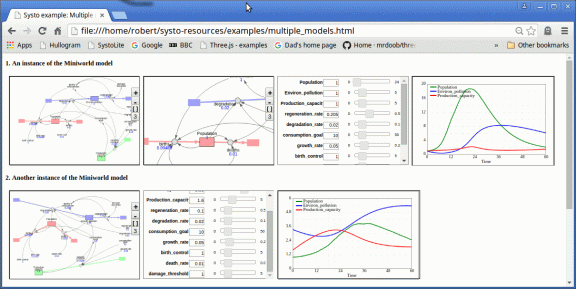
I’ve now got a very basic implementation of this idea.  The following figure shows two instances of the Miniworld model on a single page.

multiple_instances

The top row has widgets for the first instance, while the second row has widgets for the second.  (Of course, it doesn’t have to be like this – they can be arranged anyway the designer of the page wants.)   You can see that the diagrams, the parameter settings, and thus the plots, are different for the two instances, although they started off the same – they can be changed independently.

The potential offered by this enhancement to Systo is considerable.   Being able to compare alternative similar-but-different models for addressing the same problem is a fundamental part of the modeller’s craft, and current tools do little to support this activity.

One example of this could be for displaying some aspect of two or more instances of the same model within the same panel.   For example, a single widget could show the “diff” of two instances – i.e.  where the two instances are identical and where they differ, perhaps using colour-coding of the model symbols.    A previous posting on the compare_models_text widget gives an example of what this might look like.

Internals

Models in Systo are stored as a single “map” – a collection of similar objects – in SYSTO.models.    All I have done is to provide a simple utility to copy an existing model and add that to the collection of models.   Widgets are then set up with one of these copies, rather than the original model.   This is crude, but it does the job.

Because the original (master) copy and the copies themselves are stored in the same “map”, it is very easy to switch between viewing the master and a copy.    The master copy and the copies are tagged with this information, so that a web page developer can, for instance, prevent editing of the master.   Each copy is tagged with the ID of the model it came from, so that relevant metadata about the master is available to the copy.
Colouring flow networks

I’m not sure if other System Dynamics software supports this, but I thought it could help people ‘read’ a diagram if separate flow networks in a model were coloured differently, using the same colour for all the stocks and flows within each network..   Usually, stocks and flows which are connected together indicate the storages and flows of the same ‘substance’ – often a real substance (carbon, water, people…), and sometimes a notional substance (happiness…).   So the colour would indicate the substance associated with the connected set of stocks and flows.

Here is a very experimental attempt to try this:

colouring

The model is the two-species disease model that both Sysdea and Systo will be basing their demonstrations on at the forthcoming meeting of the UK Chapter of the System Dynamics Societ (London, 26-27 March 2015).    Colouring the stocks and flows clearly shows the two separate disease systems (animals in blue, humans in pink).

Once the option to over-write the default colouring scheme for stocks and flows is selected, the whole diagram is processed automatically, using a (currently) pre-defined palette of colours.

For those interested in how this is coded up: It uses a simple recursive algorithm.   It looks at each stock node in turn.  If this is already coloured, it moves on.  If not, it colours that node with the next colour from the palette, then recursively handles each flow in turn, processing the node at the other end of it if that has not already been coloured.

Spot the difference – reporting changes between model versions

Let’s imagine that you have got hold of one of my models, and think you can improve it.  Maybe you decide to add a couple of stocks and flows, change an equation or two, adjust some of the parameter values, and edit the labels for some of the variables.   Great: I’m quite prepared to believe that your model is an improvement.  But: I would like to know what changes you have made.

Wouldn’t it be good if we could do that automatically? – get a report of the things you have added, removed or changed?   The Systo widget compare_models_text does just that.      As the name suggests, it produces a text report of the differences between two models, where one is derived from the other.

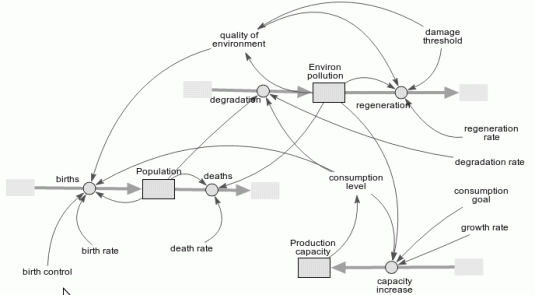
It is best understood by looking at the following two diagrams, which show two versions of a simple model (Miniworld).

Image

Image


The red circle shows where something has been removed; the green circle, where something has been added; and the red and green dots illustrate the change in node label.

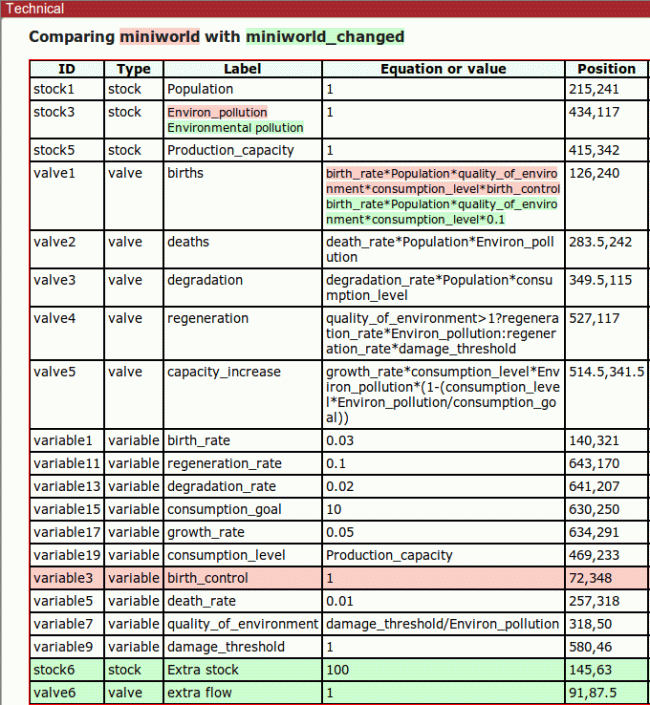
Now let’s look at the report produced by the compare_models_text widget.

Image

Pale red indicates a removal; pale green indicates an addition.   You can see that 2 nodes have been added: the stock “Extra stock” and the valve “extra flow”.   One node has been removed: the variable “birth_control”.   One label has been changed.   We can also see that the equation for the “births” valve has been changed (something not shown on the diagram).

For space reasons, I have not shown a similar report on the changes to the arrows: the loss of the influence arrow from “birth_control”, and the gain of the flow arrow into “Extra stock”.

Often you want to see just the changes, and a simple option setting allows you to suppress all identical rows (i.e. nodes and arrows which are the same in both models).

Clearly, it would be good to complement this text report with a corresponding diagram, similar to the hand-crafted one above.   I have ideas about how to do this, but have not yet started to implement it.

Note that this widget uses the internal IDs of the nodes and arrows (not their labels) to decide on which elements are the same in the two models.   So, it can work only where one model really is derived from another.  It would not work if the second model is re-implemented from scratch, even if you tried to copy the first, since there is no guarantee that all the elements will be added in the same order.   Determining similarity and differences between two independently-produced models (using, perhaps, the labels, equations and general topology of the model) is a much harder problem, and probably impossible to come up with a prefect solution that works in all situations.

Be the first to crack this Systo puzzle!

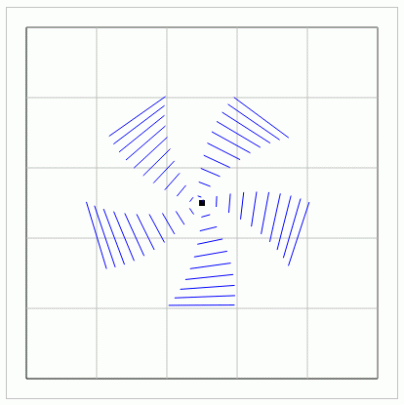
Here is a plot I got when I ran a simple Systo model.    Yes! I was amazed as you are now when I first saw it!   It’s even more amazing when you move a slider for one of the parameters, but I’m not geared up to capture that.    You’ll just have to wait until the shiny new Systo web site is up and running.

Image

So, the question is: what’s going on?    How on earth can a System Dynamics model produce this sort of pretty picture?    Extra points if you say what sort of real-world system is represented by the model.

But hurry!  I will be adding some hints from time to time, so make sure you get the answer before I give too much away.

[For an amazing coincidence, check out this item on the Guardian’s web site, also dated 14th May! ]

System Dynamics software: car or kitchen?

When we get a new car, we have to choose between different makes and models. The choice is to a large extent between complete packages, where each package has a whole variety of characteristics – fuel efficiency, size, performance, reliability .

We operate in quite a different way when we choose a kitchen. We (rarely) choose a kitchen as a complete package. Rather, we choose the individual components – the cabinets, the worktop, the cooker, the fridge and so on. We can do this because, fortunately, there is a basic infrastructure and set of conventions which allow things to work together – electricity, water and gas services, and standard dimensions.

System Dynamics software (and, indeed, most software) is like a car: we even use the term “software package”. We have to choose between one package and another, each of which has pros and cons – such as price, useability, feature-richness, and computational speed. Sure, initiatives for developing a standard model interchange language, such as XMILE, improve our ability to work with the same model on more than one platform, but that’s a bit like having several cars in the garage, and there are significant barriers, such as price, familiarisation, to the use of multiple packages.

If we think for a moment about the user interface for SD modelling, we realise that it is inherently modular: the screen consists of a number of panels.   We have the model diagram, the equation listing, a run control panel, various display tools for showing simulation results, perhaps a control panel with sliders for changing parameters, along with various dialogue windows. It is hugely wasteful for every team who wants to develop SD modelling software to have to reproduce all these components. More fundamentally, even given infinite resources to develop the software, any one platform will be a compromise between feature-richness and useability: users find too many features confusing. But on the other hand, many users will want some esoteric feature that most others don’t – the “long tail”.

As far as I know (and i’m happy to be corrected), Simile is until now the only SD modelling platform which supports this modularity, and then only to a limited extent. [Disclosure: I’m a Director and shareholder in Simulistics Ltd.] When you install Simile, even the free evaluation version, all the tools for displaying model results (graphs, tables, maps etc) are text files in the Tcl/Tk scripting language. Any user is free to edit these files, to copy and alter them, or indeed (using Simile’s API) to make their own. They can then add them into their local Simile directory, or share them with anyone else. But: this applies only to the display of results (not the display of the model); not many people know Tcl/Tk; sharing files for desktop applications is a bit tedious; and you are still after all locked into one package, i.e. Simile.

Systo sets out to see just how far we can push the kitchen model.    No aspect of the user interface is hard-wired in.    Rather, the “kitchen” (a web page) is constructed using whatever HTML the web page developer wants to provide, and whatever Systo widgets they want to include in the page.   Systo does provide a basic infrastructure (the water, gas and electricity services), but all the rest is chosen by the developers – they shop around on the web for suitable “appliances”, confident in the knowledge that they can just plug them into the web page.

Arguably, this approach is much closer to Tim Berners-Lee original conception of the web – as a peer-to-peer sharing of information. This contrasts totally with the current model: monolithic and centralised web apps on a single site, with the site owners dictating the whole of the user interface.

Of course, not everyone wants to design a kitchen from scratch.   If you are going for a week’s self-catering, you expect to find a fully-equipped kitchen waiting for you.   And so it is with modelling on the web: most users will have no interest in writing HTML, or Systo’s widget-based approach.    They just want a nice, functional site which suits their needs, in terms of the models it provides or the tools available for working with models.   That’s fine: they will just go to one of the many Systo-based web sites for doing their modelling, and they may not even be aware that the site is not a  conventional web app.

So: let’s start cooking!

Welcome to the Systo blog

Systo is  an open, adaptable and lightweight approach for viewing, building and running systems models in web pages.

At its core, Systo allows anyone with minimal knowledge of HTML and Javascript to build a web page for viewing, building and simulating the behaviour of simulation models.

The key underlying concept is that a web page is assembled from a set of widgets.   Each widget handles one aspect of working with models:; for example:
– displaying the model diagram;
– displaying a graph of simulation results;
– listing the model equations.
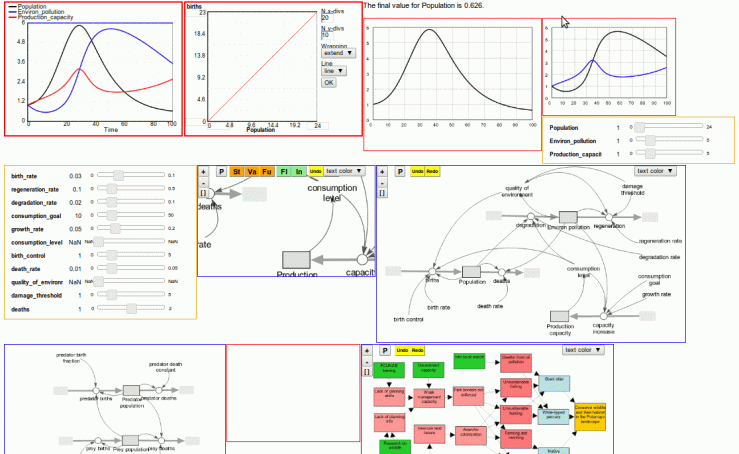
The following screendump illustrates the approach with a sample of widgets from a Systo-based webpage.

sample_widgets

The way that web page developers do this is very similar to the way that they include images in a web page, but inserting <div> rather than  <img> elements at the appropriate place.  Then, instead of linking to something static (the image), the element is linked to the widget which performs the appropriate task (such as plotting a graph) – this can be done with a single line of Javascript.   The widgets themselves can live anywhere on the web: one page can pull in widgets from a variety of URLs (just like one could do with images).    

This approach is in marked contrast with almost all web apps, which provide a single, monolithic, “walled garden” web site: a single URL (such as http://www.facebook.com) which totally controls how you can work.    With Systo, there can be 100s of Systo-based web sites, each reflecting web-page design choices made by the web-page developer.

Moreover, anyone with the ability to program in Javascript can make their own widgets – either by modifying an existing one or by creating a new one from scratch.   Some of these could be improvements on exiting ones; others could implement some great innovative idea about how to work with models.

Together, these characteristics of Systo promise to unleash a great burst of creativity in the way we model.    Web page developers will design really engaging web pages, perhaps incorporating audio, video, graphics and images to go along with model diagrams and display of results.  Anyone interested in improving the way we work with models just has to make a single widget, piggy-backing on pre-exiting components for handling other aspects of the modelling process, rather than having to develop heir own modelling environment from scratch.

This blog starts as Systo cautiously approaches its initial release.   I will be reporting on developments, and ruminating on some of the issues faced while working on it.    Hopefully, others will join in – if only to suggest better ways of doing things!